
Decline Curve Analysis
Alan Mourgues
Fit decline curves to production data and generate forecasts using Arps equations in Excel.
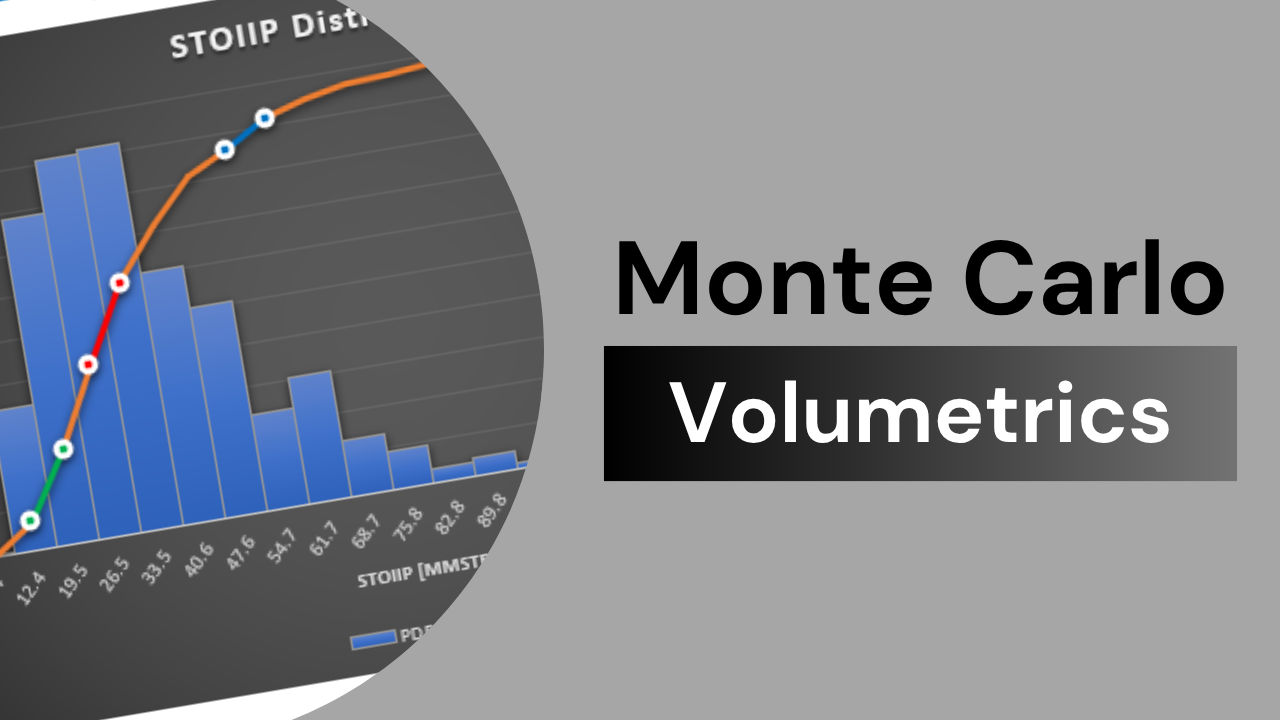
Monte Carlo Volumetrics
Alan Mourgues
Estimate in-place volumes using Monte Carlo simulation with transparent inputs and outputs directly in Excel.

PVT Correlations
Alan Mourgues
Calculate oil, gas, and water PVT properties using industry-standard correlations directly in Excel.

RFT / MDT Pressure Analysis
Alan Mourgues
Analyse RFT/MDT pressure data to estimate gradients, fit trends, and identify free fluid levels in Excel.

Gas Material Balance (P/Z)
Alan Mourgues
Perform gas material balance using P/Z analysis to estimate OGIP, EUR, and recovery factors in Excel.

Critical Lift Rate
Alan Mourgues
Calculate critical lift rate (Qcr) in gas wells using Turner and Coleman correlations in Excel.

Oil Flowing Material Balance (FMB)
MAHMOUD Mahmoud
Estimates original oil in place from rate-normalized flowing pressure data using pseudo-steady state flow and depletion relationships.

Relative Permeability Curves
Alan Mourgues
Generate and adjust relative permeability curves and export simulation-ready tables directly from Excel.

Fluid Pressure Gradient from Fluid Properties
Alan Mourgues
Calculate pressure gradients (dP/dz) from fluid properties at reservoir conditions.

Oil Rate Transient Analysis (RTA)
MAHMOUD Mahmoud
Performs rate transient analysis using Blasingame type curve matching to estimate reservoir and well parameters

Gas Flowing Material Balance (GFMB)
MAHMOUD Mahmoud
Estimates OGIP from flowing pressure and rate data under boundary-dominated flow conditions.

PVT Correlations for Malaysian Oils
Larry Wilcox
Generate region-specific PVT properties from Malaysian oil datasets using empirical correlations.

Build Engineering Apps in Excel (VBA)
Alan Mourgues
Design and implement Excel-based applications using VBA forms and custom interfaces.

PTA Log–Log Interpretation Catalog
Alan Mourgues
Reference log–log derivative signatures for pressure transient analysis and interpretation.

Radial Pressure Profile (IARF)
Alan Mourgues
Compute and visualize radial pressure profiles for infinite-acting reservoirs using the diffusivity equation solution.
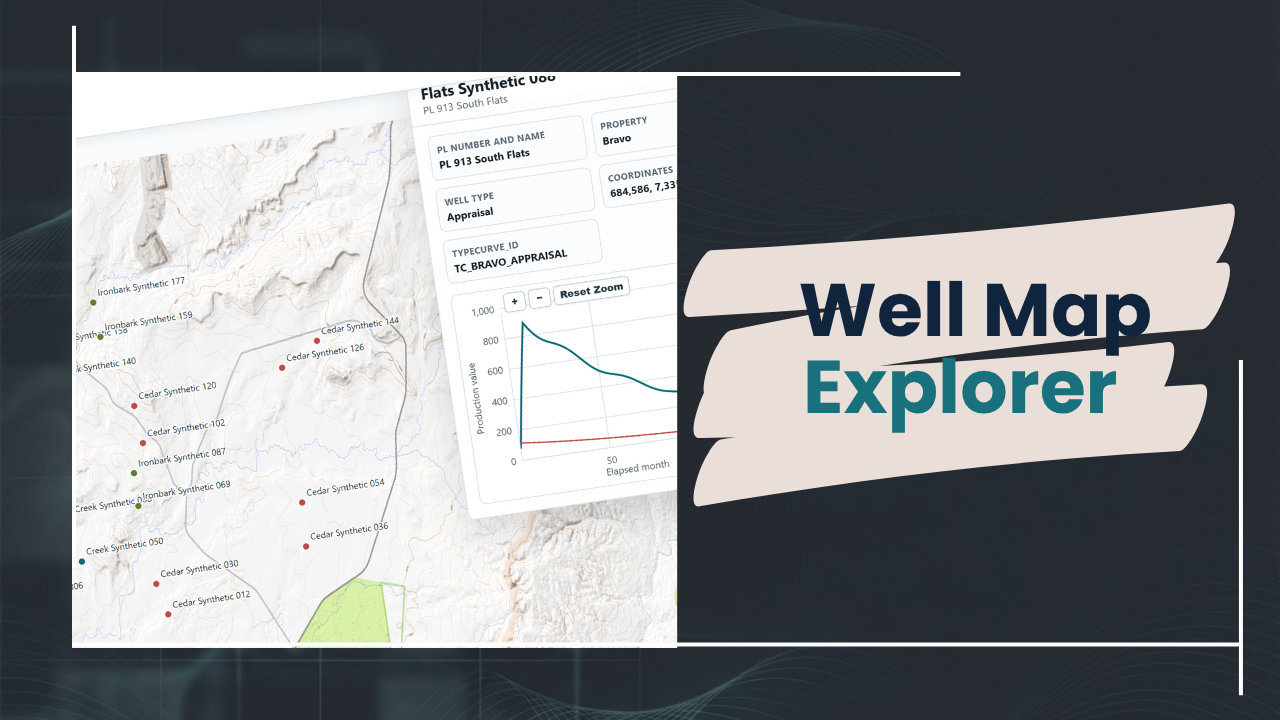
Well Map Explorer
Alan Mourgues
Interactive well map for visualizing well locations, static metadata, and production type curves. Import CSV or JSON files, explore data, and export results.
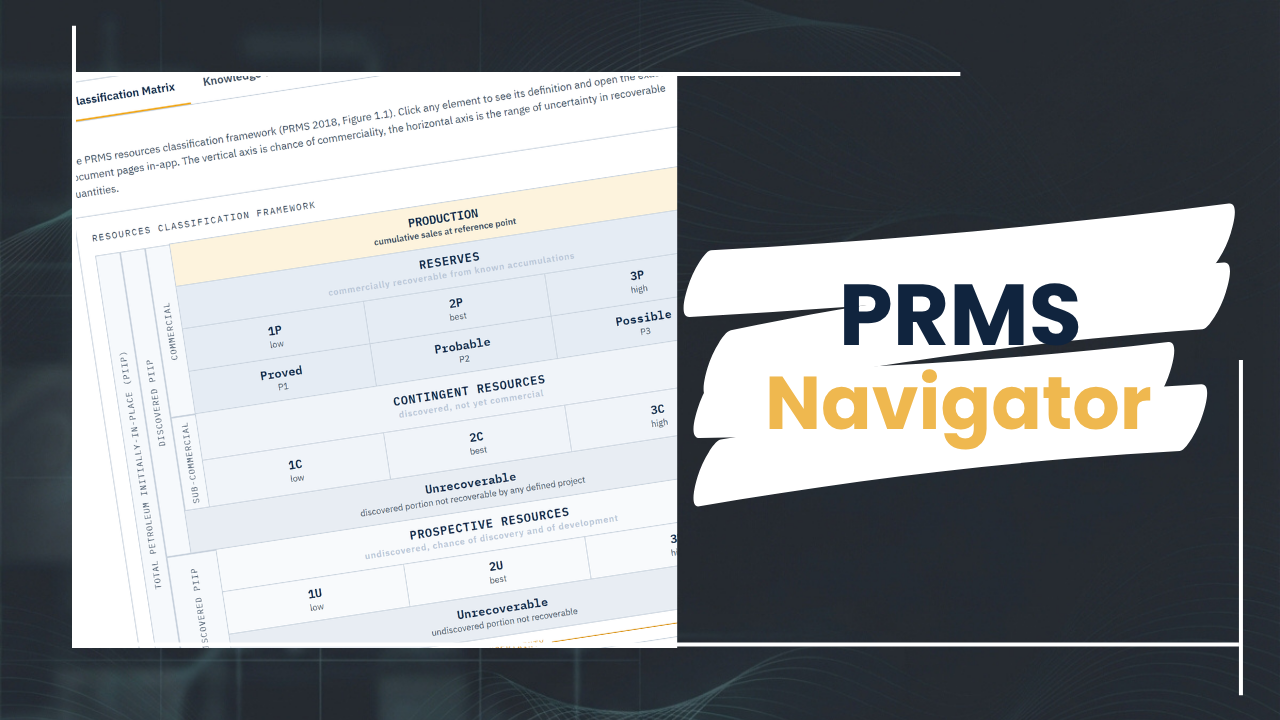
PRMS Navigator
Alan Mourgues
Explore the PRMS classification system on a clickable matrix and on an interactive wheel with searchable text from the official guidelines, for reserves professionals.

IARF Pressure Profile
Alan Mourgues
Explore pressure, skin, and drawdown behaviour in radial flow reservoirs with adjustable parameters for reservoir and well test engineers.

VOI - Bayes Decision Lab
Alan Mourgues
Test whether seismic is worth shooting before drilling, with a Bayesian value of information tool for subsurface teams.

Gas Plateau Fall Off
Alan Mourgues
Explore how plateau rate choices shift gas field fall off timing, a tool for reservoir, production and development planning engineers.

Field Profile Builder
Alan Mourgues
Build an aggregated field gas production profile from well type curves and a drilling schedule, for reservoir and production engineers.

PTA Log-Log App
Alan Mourgues
Explore 19 annotated well test log-log signatures and build full pressure transient responses, a reference and training aid for subsurface engineers.

GeoFracture3D
Juan Pablo Radic
Analyse how fracture networks and stress conditions shape directional permeability for coal seam gas reservoirs.

GeoMechPro
Juan Pablo Radic
Calculate 3D in-situ stress profiles from well log data, with calibration tools for geoscientists working on drilling and reservoir geomechanics.

GeoSlipPRO
Juan Pablo Radic
GeoSlipPRO: fault reactivation analysis under evolving stress states, mapping fluid flow pathways for geothermal, mineral, and hydrocarbon exploration.

Skin to WPIMULT Conversion
Alan Mourgues
Convert between skin factor and WPIMULT using Darcy and ECL inflow relationships.

Radial Flow Log–Log Response (Diffusivity Solution)
MAHMOUD Mahmoud
Compute log–log pressure and derivative responses from radial diffusivity solutions using Laplace inversion.

Gas Well Inflow (Darcy Equation)
Alan Mourgues
Compute gas well inflow performance using Darcy-based relationships between rate, pressure, permeability, and skin.
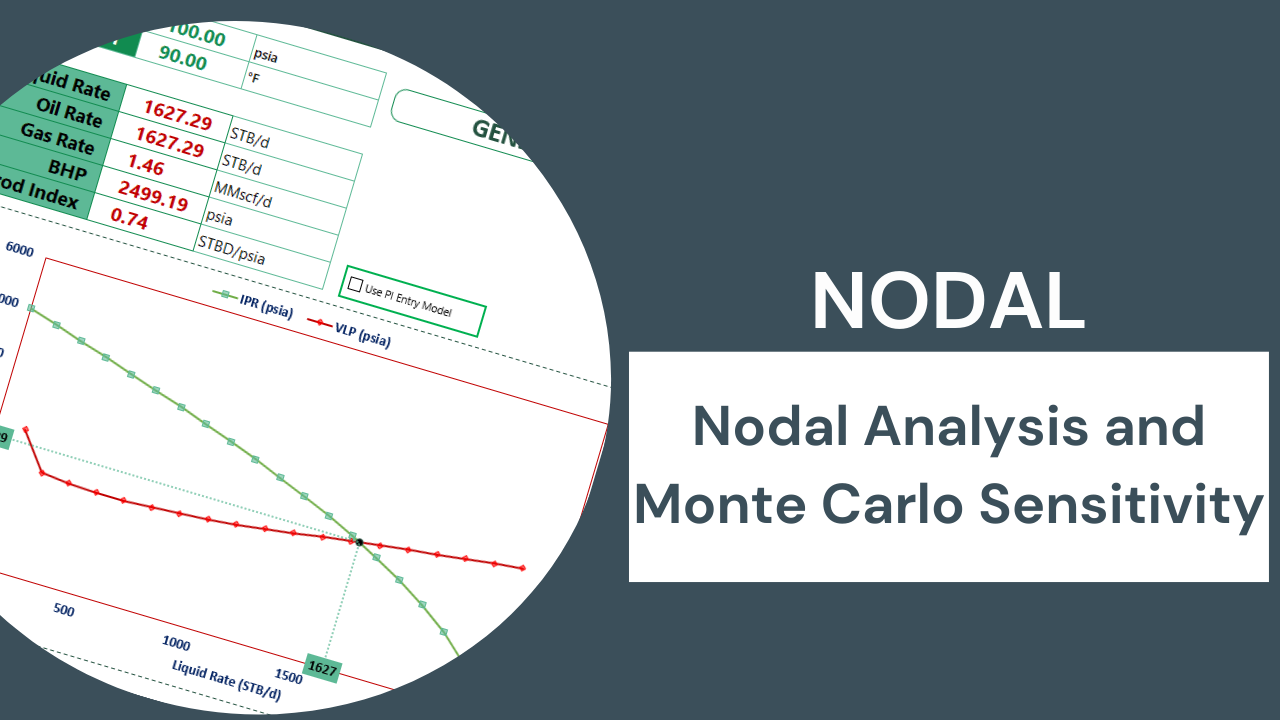
Oil Well IPR–VLP Performance Evaluation
MAHMOUD Mahmoud
Calculates IPR and VLP curves, operating point, and probabilistic well performance cases from reservoir, fluid, and tubing inputs.
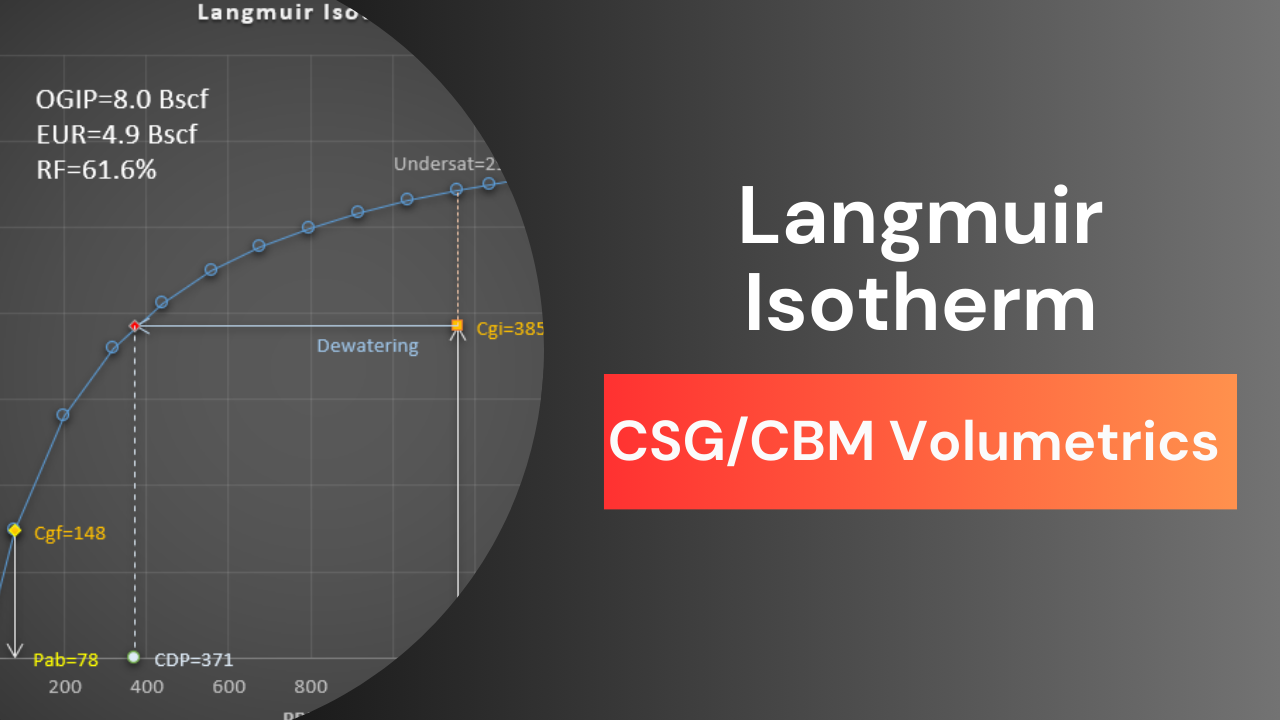
Langmuir Isotherm Volumetrics (CSG/CBM)
Alan Mourgues
Estimate gas-in-place and recovery for CSG/CBM reservoirs from an interactive Langmuir isotherm chart.

PVT Solver
Mohamed Bahaaeldin
Desktop application for calculating black oil, dry gas, and formation water PVT properties using multiple fluid correlations and best-fit model matching.

Petrophysics: The Cuddy Challenge
Alan Mourgues
Test your petrophysics thinking on BVW, height functions, and saturation with a 10-question quiz inspired by Steve Cuddy.

GeoStruct 3D
Juan Pablo Radic
GeoStruct3D is a browser-based application for 3D structural visualization, engineered to transform and project 2D structural data and maps into high-fidelity three-dimensional insights.

Fault Seal
Alan Mourgues
Step inside the Fault Seal Challenge, an interactive, AI-powered training tool designed to help wellsite geologists and susbsurface pros understand how stratigraphy, fault kinematics, and diagenesis control trap integrity.

Spot the Hidden Oil
Alan Mourgues
Think oil is just fuel? Think again. Discover how many everyday items around you come from oil & gas.

Oil Price Shock
Alan Mourgues
Explore the knock-on effects of a $50/bbl oil world and test your knowledge and intuition.

Saturation Guru
Alan Mourgues
An interactive Q&A game based on Dan O’Meara’s Saturation Confusion series, designed to test your intuition on saturation modelling, permeability, and J-functions.

Thinking in Pores
Alan Mourgues
A short-form game that challenges how you reason about capillarity, pressure, and multiphase flow at the pore scale.

PTA Log–Log Catalog (IFP/Bourdet)
Alan Mourgues
Reference log–log derivative models for pressure transient analysis based on Bourdet methodology.


